Know before the user calls
The monitoring module of the Central Operations Dashboard (COD, the central operations and management platform for your IT) checks firewalls and devices via active ICMP/TCP probing (Internet Control Message Protocol and Transmission Control Protocol, i.e. ping and port checks) around the clock and alerts you before the next ticket comes in.
Who notices first that a firewall has failed, your administrator or the annoyed user? The COD monitoring module checks your devices around the clock and raises the alarm before the next ticket comes in. Multi-tenant, fully on-premises and KRITIS-ready, you see immediately what is down, since when and why.
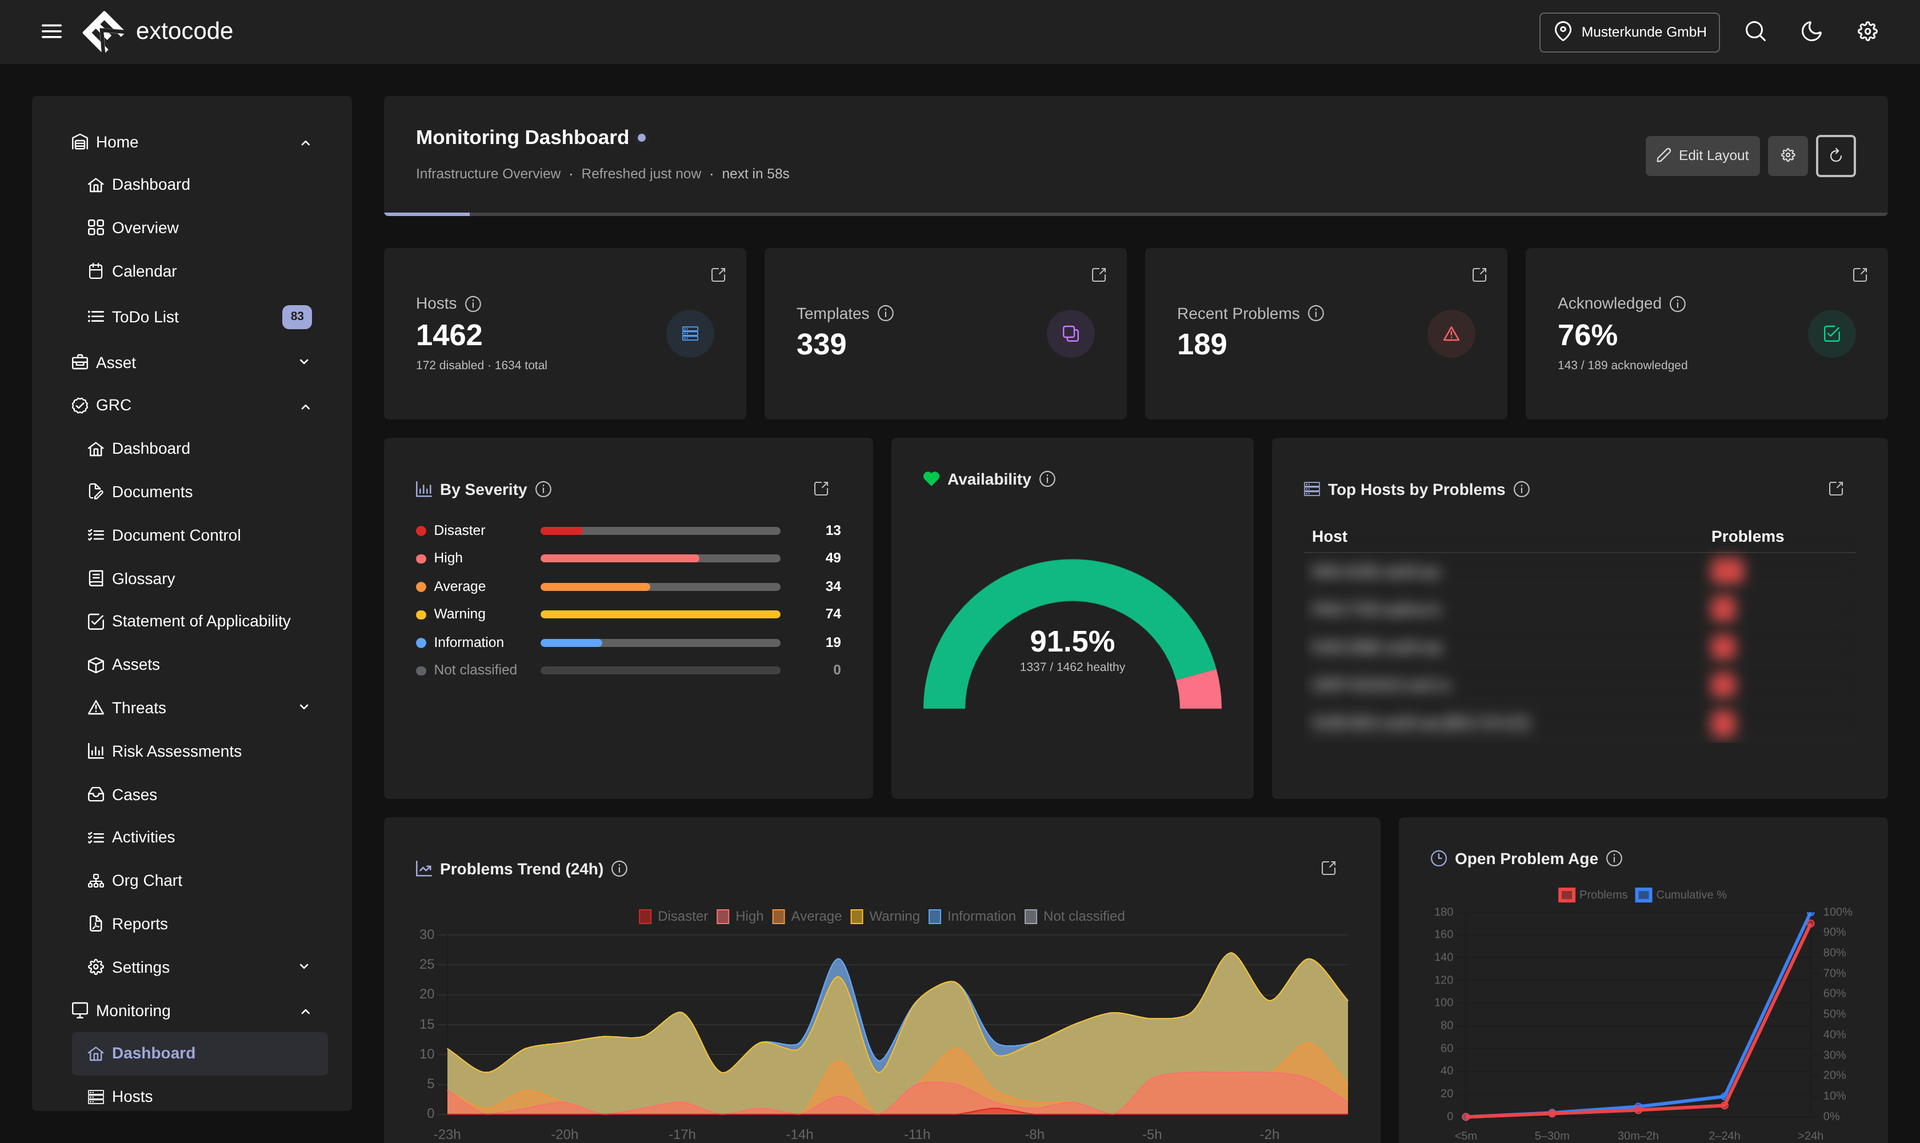
Active probing around the clock
ICMP and TCP probing via fping continuously checks the reachability of your firewalls and devices, instead of reacting only once someone calls.
- Active ICMP/TCP probing with fping, continuously in the background
- Check interval via a configurable cron per tenant, matching every customer and site
- Reachability for firewalls and all monitored devices at a glance
Email alerts with intelligent throttling
If a device fails, COD notifies you immediately by email. So that a single incident does not turn into an alert flood, the monitoring works with built-in throttling.
- Immediate email notification when a device fails
- Throttling per firewall prevents repeated alerts about the same problem
- Schedule planned maintenance centrally in the COD calendar, so the monitoring does not fire without reason
Polling status per device: OK / Error / Unknown
Every row in the network inventory carries a clear, traceable status with timestamp and reason, not just a red light without context.
- Status OK / Error / Unknown per device with timestamp
- Tooltip reason in plain text: timeout, auth, refused
- Visible source of the check: SNMP / SSH / API
Severity overview: what is down, since when and why
Open problems appear sorted by severity, including a history of the last 24 hours. That way you prioritize the most important issues first, without digging through lists.
- Open problems sorted by severity instead of unsorted event lists
- History of the last 24 hours for a quick trend overview
- Availability, problems and history centrally in one dashboard
Part of the COD platform
Monitoring is not a siloed tool but a module of the Central Operations Dashboard, on the same living data set as network, assets, firewall and GRC.
- Multi-tenant and role-based (LDAP/AD or local users)
- Fully deployable on-premises, KRITIS-ready, full control of your data
- Direct connection to the network inventory and maintenance calendar
Frequently asked questions
See monitoring live
Request a live demo and see the monitoring module hands-on in your own environment, or download the datasheet with all features compactly on one page.